How to tell if a New Launch is overpriced.
In a previous article where I was exploring doing my own research on why CCR produce the most losers overall, one of the key discoveries was how important a good entry price was, it was the single most important factor that decided whether you were going to make a profit or loss.
Cityvista Residences
| Unit | Sold | Size | Exit Price | Exit PSF | Est. Entry PSF | Hold | Profit / Loss |
|---|---|---|---|---|---|---|---|
| 21 Peck Hay Road #15-03 | Feb 2026 | 2,809 sqft | $6.00M | $2,136 psf | ~$2,828 psf | ~18.6 yrs | -$1.94M |
| 21 Peck Hay Road #17-02 | Dec 2024 | 2,626 sqft | $5.55M | $2,113 psf | ~$2,776 psf | ~17.4 yrs | -$1.74M |
| 21 Peck Hay Road #15-02 | Jun 2025 | 2,626 sqft | $5.48M | $2,086 psf | ~$2,627 psf | ~17.9 yrs | -$1.42M |
On paper, it had the ingredients buyers usually trust: freehold tenure, District 9, Newton/River Valley location, large-format homes. But the problem was not the address. It was the entry price.
One 2,809 sqft unit at 21 Peck Hay Road sold in February 2026 for $6.0 million, or about $2,136 psf. That sounds like a respectable CCR exit price. The problem is that the owner appears to have paid about $7.94 million in 2007, which works out to roughly $2,828 psf.
After almost 19 years of holding, the sale still crystallised a loss of about $1.94 million. This was not a short-term flip gone wrong. This was nearly two decades of holding a freehold CCR property, and even time could not fully repair a severely stretched entry price.
So how do we actually calculate what is a "safe entry"?
The most common way of doing so is to compare with neighbouring projects, to see what they are currently transacting at, but the problem with this method is that it's not always a fair comparison. Imagine comparing a brand new launch to a neighbouring condo that is already 40 years old, they are simply not comparable.
What I thought of instead was...
The idea is simple, in order to determine your walk-away price, we simply take:
Price-to-index multiple = Entry PSF ÷ URA regional non-landed price index
So if a new launch in the RCR is asking $2,800 psf, and the RCR non-landed price index is 228.9, the ratio is:
2,800 ÷ 228.9 = 12.2 multiple
That number is not magic. It does not tell you whether the condo is “good” or “bad”. What it tries to do is simpler: it tells you how stretched the asking price is relative to the market cycle.
The lower the Entry Multiple, the less stretched the entry price looks. The higher the Entry Multiple, the more stretched it looks. In simple terms: a lower number suggests you are paying a more reasonable price relative to where the regional market already is; a higher number suggests the buyer may be paying too much into an already elevated market.
Here's how the theory looks like in practice
So instead of building this theory around one dramatic example, I wanted to test it across the actual resale records.
I took the top 10 biggest profit transactions and the top 10 biggest loss transactions over the latest two-year resale window, then worked backwards:
- what did the buyer likely pay?
- what was their entry PSF?
- what was the URA regional index at that purchase quarter?
- what was the Entry Multiple?
The result was not perfectly clean, but it was useful.
Top 10 Absolute Winners
| Rank | Project | Region | Purchase Q | Size | Entry PSF | Sold | Selling PSF | Profit | Holding Period | Entry Multiple |
|---|---|---|---|---|---|---|---|---|---|---|
| 1 | Honolulu Tower | CCR | 2009Q4 | 5,823 sqft | $1,202 psf | May 2026 | $2,438 psf | $7.20M | 16.5 yrs | 10.3 |
| 2 | Ardmore Park | CCR | 2010Q1 | 2,885 sqft | $1,906 psf | Apr 2025 | $4,160 psf | $6.50M | 15.2 yrs | 15.6 |
| 3 | Yong An Park | CCR | 2011Q2 | 6,878 sqft | $1,236 psf | Feb 2025 | $2,181 psf | $6.50M | 13.9 yrs | 9.0 |
| 4 | The Marq On Paterson Hill | CCR | 2007Q3 | 6,232 sqft | $5,039 psf | Jan 2026 | $5,937 psf | $5.60M | 18.5 yrs | 42.8 |
| 5 | Leedon Residence | CCR | 2017Q1 | 4,704 sqft | $1,871 psf | Feb 2026 | $2,976 psf | $5.20M | 9.0 yrs | 14.8 |
| 6 | Four Seasons Park | CCR | 2006Q2 | 2,874 sqft | $1,572 psf | Apr 2026 | $3,229 psf | $4.76M | 20.0 yrs | 18.2 |
| 7 | Grange Residences | CCR | 2006Q1 | 2,583 sqft | $1,486 psf | Aug 2025 | $3,290 psf | $4.66M | 19.4 yrs | 18.0 |
| 8 | Nassim Park Residences | CCR | 2009Q4 | 3,175 sqft | $3,089 psf | Jul 2024 | $4,472 psf | $4.39M | 14.7 yrs | 26.4 |
| 9 | Jadescape | RCR | 2019Q4 | 4,230 sqft | $1,371 psf | Dec 2024 | $2,399 psf | $4.35M | 5.0 yrs | 8.9 |
| 10 | Leedon Residence | CCR | 2017Q2 | 6,125 sqft | $1,959 psf | Mar 2025 | $2,612 psf | $4.00M | 8.0 yrs | 15.6 |
Top 10 Absolute Losers
| Rank | Project | Region | Purchase Q | Size | Entry PSF | Sold | Selling PSF | Loss | Holding Period | Entry Multiple |
|---|---|---|---|---|---|---|---|---|---|---|
| 1 | St Thomas Suites | CCR | 2011Q3 | 7,686 sqft | $2,905 psf | Mar 2025 | $2,086 psf | -$6.30M | 13.5 yrs | 21.0 |
| 2 | Cliveden At Grange | CCR | 2007Q3 | 2,153 sqft | $3,905 psf | Nov 2024 | $2,183 psf | -$3.71M | 17.3 yrs | 33.2 |
| 3 | Marina Collection | CCR | 2008Q1 | 3,272 sqft | $2,636 psf | Jul 2025 | $1,513 psf | -$3.67M | 17.5 yrs | 20.1 |
| 4 | Marina Bay Residences | CCR | 2007Q2 | 4,478 sqft | $3,480 psf | May 2026 | $2,680 psf | -$3.58M | 19.1 yrs | 32.0 |
| 5 | Marina Collection | CCR | 2010Q1 | 4,725 sqft | $2,185 psf | Dec 2025 | $1,439 psf | -$3.52M | 15.9 yrs | 17.9 |
| 6 | Marina Bay Residences | CCR | 2022Q2 | 2,379 sqft | $3,500 psf | Aug 2025 | $2,144 psf | -$3.23M | 3.2 yrs | 24.8 |
| 7 | Cliveden At Grange | CCR | 2007Q3 | 2,153 sqft | $3,649 psf | Jan 2025 | $2,230 psf | -$3.06M | 17.4 yrs | 31.0 |
| 8 | Marina Collection | CCR | 2010Q1 | 3,789 sqft | $2,479 psf | Jul 2024 | $1,768 psf | -$2.69M | 14.4 yrs | 20.3 |
| 9 | Seascape | CCR | 2010Q3 | 2,680 sqft | $2,712 psf | Mar 2025 | $1,716 psf | -$2.67M | 14.5 yrs | 20.7 |
| 10 | Belle Vue Residences | CCR | 2013Q2 | 5,425 sqft | $1,935 psf | Jul 2025 | $1,465 psf | -$2.55M | 12.2 yrs | 13.7 |
Note: The Marq on Paterson Hill shows an Entry Multiple of 42.8 and still made $5.6 million. Nassim Park Residences shows 26.4 and still made $4.39 million.
But those are not ordinary condos.
The Marq is the kind of asset that behaves less like a normal apartment and more like trophy real estate. Nassim Park Residences sits in one of Singapore’s most prestigious private residential enclaves. These are the kinds of homes where scarcity, address, buyer profile, and ultra-luxury positioning can overwhelm a simple valuation metric.
The more interesting row is Jadescape but that's a topic for another time.
The loser table tells a much cleaner story. Eight of the ten biggest losers had Entry Multiples above 20. Four were above 30. But there's a problem...
St Thomas Suites
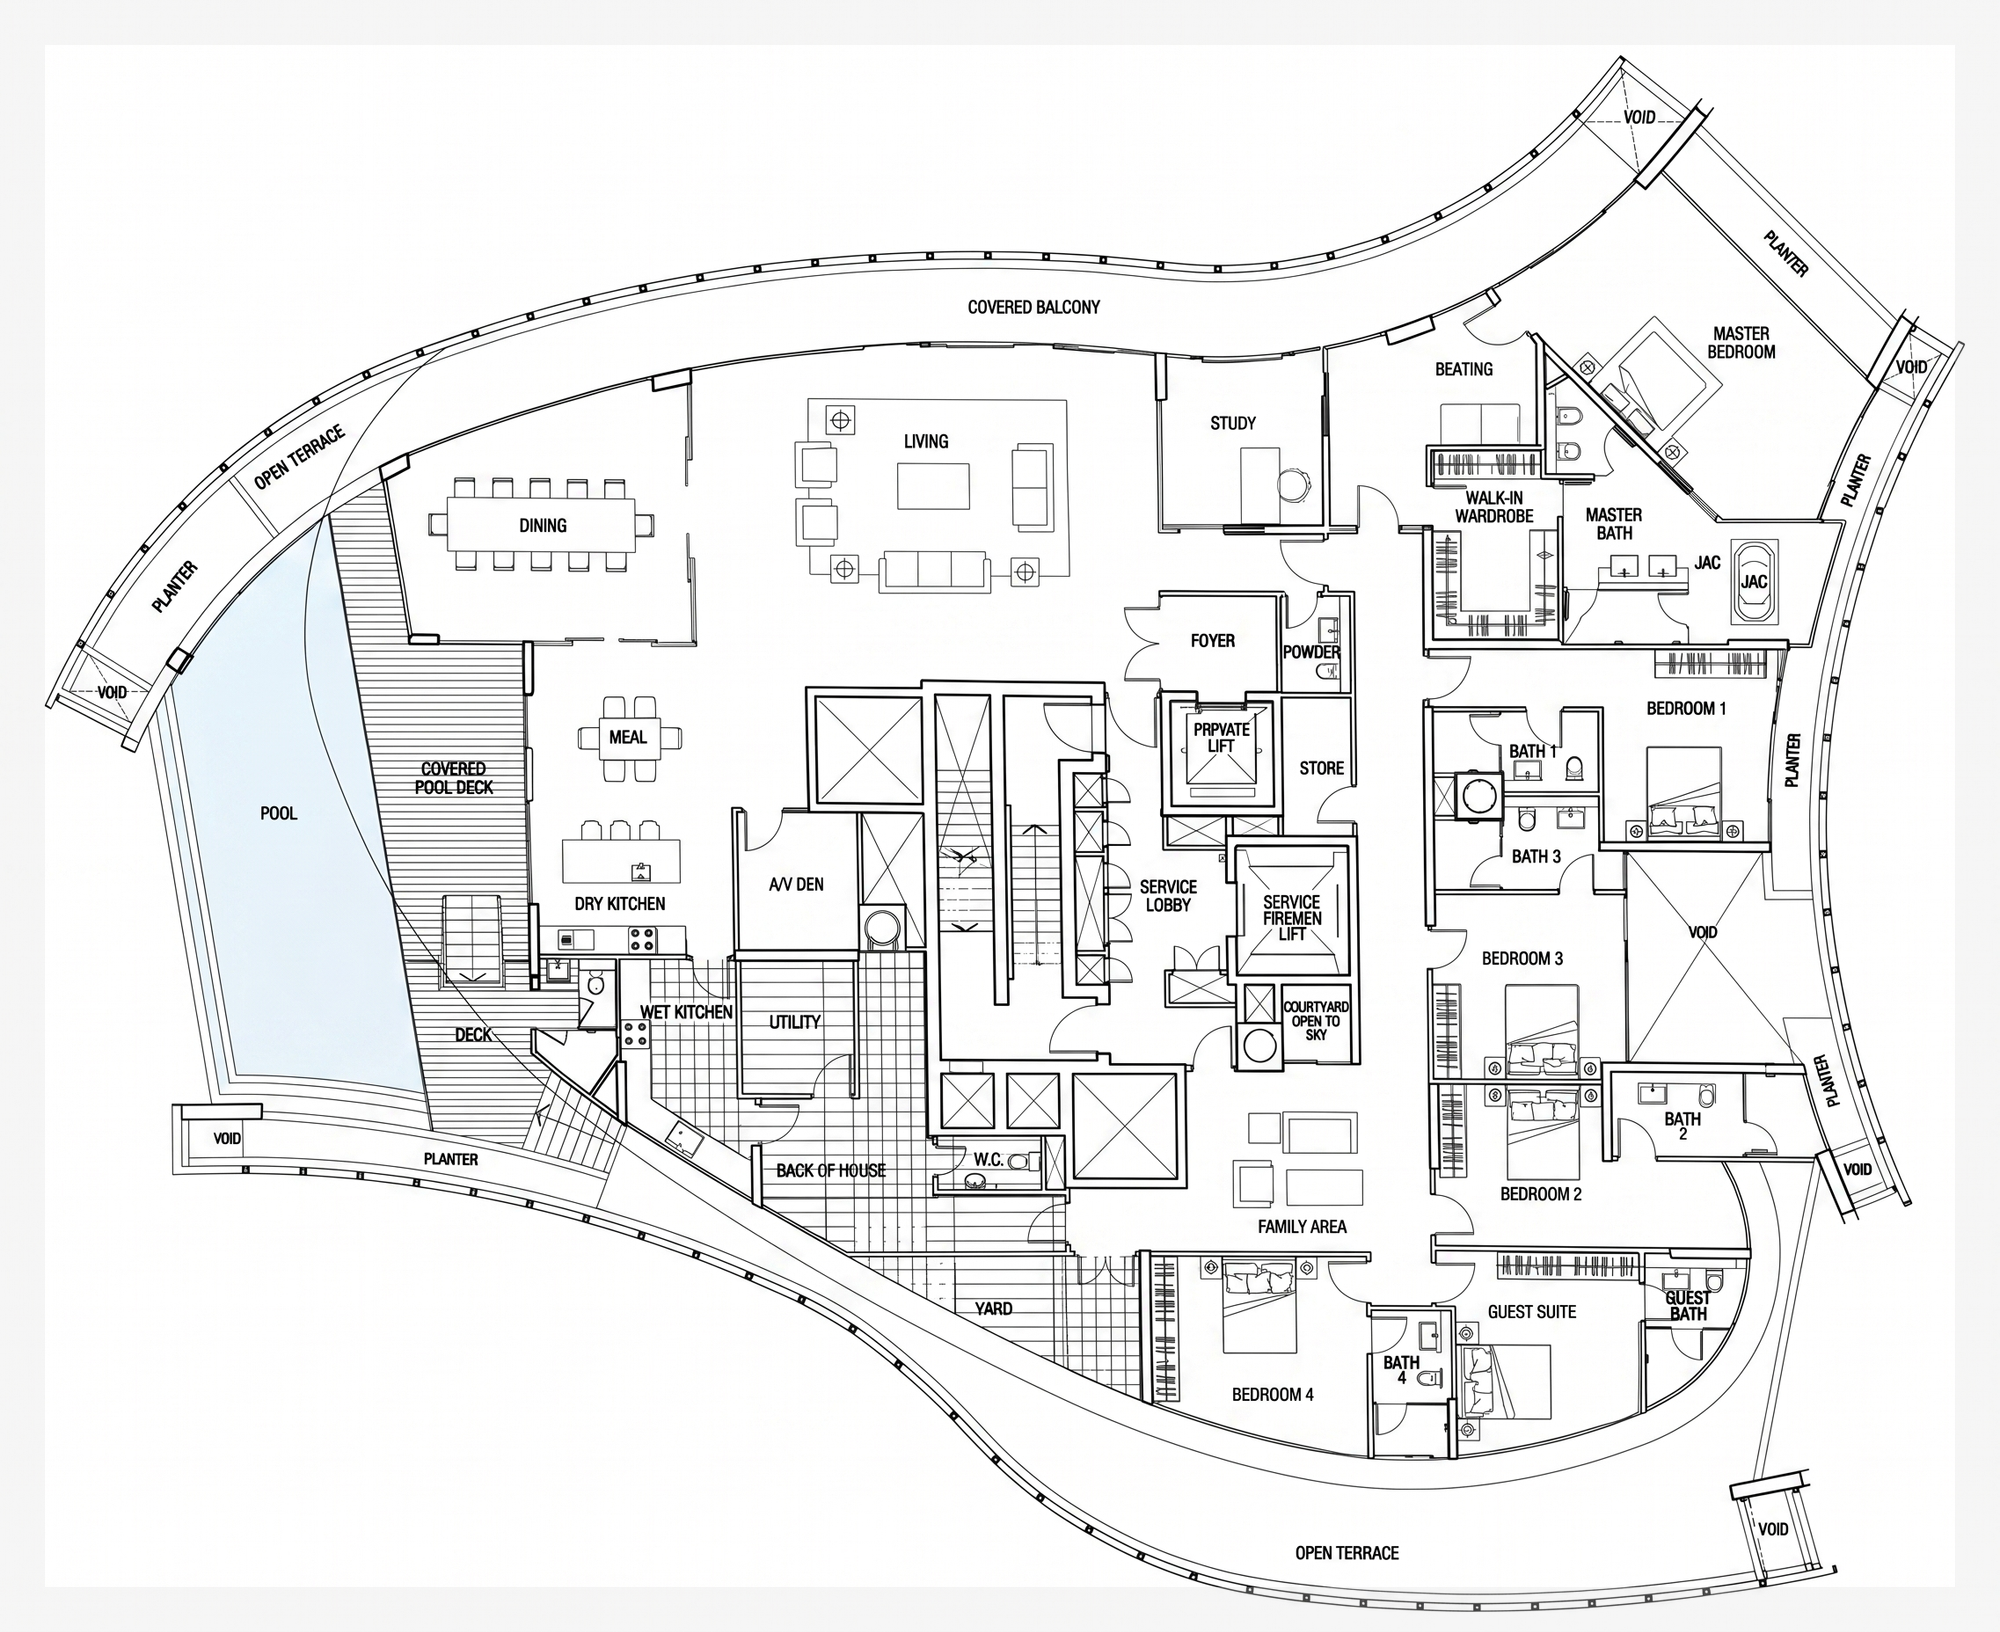
The biggest loss in the table was St Thomas Suites, but this is where the data needs context.
This was not a typical apartment. It was a 7,686 sqft penthouse with a private pool, large terrace areas, and a highly unusual layout. That matters because penthouses do not behave like normal units. Their buyer pool is narrower, their floor-area efficiency can be very different, and a large amount of the “size” may sit in outdoor or lifestyle space rather than regular internal living area.
So yes, the Entry Multiple was high at 21.0. And yes, the loss was enormous at about $6.3 million.
But this is not the cleanest proof that a high Entry Multiple hurts normal buyers. It is better read as an extreme luxury/penthouse warning: when a buyer pays a stretched multiple for a highly specialised unit, the exit risk becomes even more severe because the next buyer pool is so thin.
And this was the case for most of the losers as well so...
What if we remove CCR from the picture?
CCR is not a normal market. It contains trophy homes, penthouses, ultra-luxury stock, Sentosa units, and projects where the buyer pool is completely different from the mass private market.
That is why the winner table had strange rows like The Marq and Nassim Park Residences. These are not ordinary condos. They can trade on scarcity, prestige, and buyer profile in a way that a normal resale condo cannot.
So the cleaner test is this:
What happens if we look only at RCR and OCR?
Top 10 Winners: RCR/OCR, 1,000-1,500 sqft, 5-10 Year Hold
| Rank | Project | Region | Purchase Q | Size | Entry PSF | Sold | Selling PSF | Profit | Holding Period | Entry Multiple |
|---|---|---|---|---|---|---|---|---|---|---|
| 1 | The Sea View | RCR | 2017Q1 | 1,410 sqft | $1,574 psf | Mar 2025 | $2,710 psf | $1.60M | 8.1 yrs | 11.5 |
| 2 | Hundred Palms Residences | OCR | 2017Q3 | 1,324 sqft | $852 psf | Jun 2025 | $2,039 psf | $1.57M | 7.9 yrs | 5.5 |
| 3 | The Atria At Meyer | RCR | 2015Q3 | 1,475 sqft | $1,288 psf | Aug 2024 | $2,292 psf | $1.48M | 9.0 yrs | 9.1 |
| 4 | One Amber | RCR | 2016Q3 | 1,453 sqft | $1,239 psf | Sep 2024 | $2,240 psf | $1.46M | 8.1 yrs | 8.9 |
| 5 | City Square Residences | RCR | 2017Q1 | 1,496 sqft | $1,203 psf | Jan 2025 | $2,155 psf | $1.43M | 7.8 yrs | 8.8 |
| 6 | The Esta | RCR | 2017Q4 | 1,346 sqft | $1,611 psf | Feb 2026 | $2,593 psf | $1.32M | 8.3 yrs | 11.6 |
| 7 | Parc Esta | RCR | 2018Q4 | 1,399 sqft | $1,631 psf | Mar 2026 | $2,573 psf | $1.32M | 7.3 yrs | 10.9 |
| 8 | Forest Woods | OCR | 2016Q4 | 1,281 sqft | $1,400 psf | Jan 2026 | $2,420 psf | $1.31M | 9.3 yrs | 9.1 |
| 9 | The Arte | RCR | 2017Q1 | 1,399 sqft | $1,237 psf | Mar 2026 | $2,137 psf | $1.26M | 9.0 yrs | 9.0 |
| 10 | Parkshore | RCR | 2018Q1 | 1,335 sqft | $1,377 psf | Dec 2025 | $2,308 psf | $1.24M | 7.9 yrs | 9.8 |
Weakest Outcomes: RCR/OCR, 1,000-1,500 sqft, 5-10 Year Hold
| Rank | Project | Region | Purchase Q | Size | Entry PSF | Sold | Selling PSF | Profit / Loss | Holding Period | Entry Multiple |
|---|---|---|---|---|---|---|---|---|---|---|
| 1 | Corals At Keppel Bay | RCR | 2014Q4 | 1,281 sqft | $2,186 psf | Sep 2024 | $2,038 psf | -$190K | 9.9 yrs | 14.9 |
| 2 | The Crest | RCR | 2019Q1 | 1,313 sqft | $2,078 psf | Apr 2025 | $1,933 psf | -$190K | 6.3 yrs | 14.0 |
| 3 | Reflections At Keppel Bay | RCR | 2019Q3 | 1,227 sqft | $1,612 psf | Jan 2025 | $1,514 psf | -$120K | 5.5 yrs | 10.4 |
| 4 | The Line @ Tanjong Rhu | RCR | 2017Q4 | 1,216 sqft | $2,376 psf | Sep 2025 | $2,286 psf | -$109K | 7.7 yrs | 17.1 |
| 5 | Kallang Riverside | RCR | 2018Q2 | 1,033 sqft | $2,073 psf | Dec 2024 | $2,081 psf | $8K | 6.6 yrs | 14.0 |
| 6 | Sky Green | RCR | 2018Q4 | 1,033 sqft | $1,441 psf | Jul 2025 | $1,500 psf | $61K | 6.6 yrs | 9.7 |
| 7 | Whitehaven | RCR | 2014Q4 | 1,055 sqft | $1,064 psf | Nov 2024 | $1,138 psf | $78K | 9.9 yrs | 7.3 |
| 8 | Kingsford . Hillview Peak | OCR | 2016Q4 | 1,087 sqft | $880 psf | Oct 2024 | $957 psf | $83K | 7.8 yrs | 5.7 |
| 9 | Cradels | RCR | 2018Q1 | 1,033 sqft | $1,307 psf | Apr 2026 | $1,393 psf | $89K | 8.1 yrs | 9.3 |
| 10 | Kandis Residence | OCR | 2018Q1 | 1,023 sqft | $1,300 psf | Jul 2024 | $1,389 psf | $90K | 6.3 yrs | 7.9 |
This cleaner RCR/OCR slice makes the framework more useful, but also more honest.
The winners mostly entered at friendly multiples, mostly between about 5.5 and 11.6. That makes sense. These buyers were not paying heavily stretched prices relative to the market cycle.
But the loser table adds an important warning.
Not every weak outcome came from an obviously stretched multiple.
Corals at Keppel Bay, The Crest, and The Line @ Tanjong Rhu had high-ish multiples, so those are easier to understand. The entry was expensive, and the resale outcome was weak.
But then there are rows like 38 iSuites, The Creek @ Bukit, Kingsford Hillview Peak, Whitehaven, Cradels, and Kandis Residence. Some of these entered at much lower multiples, yet still ended up among the weakest performers in the sample.
That means the Entry Multiple can tell you whether the price looks stretched against the market cycle.
It cannot tell you whether the project itself deserves to trade cheaply.
Some properties are cheap because they are mispriced.
Others are cheap because the market is correctly discounting them.
What this means is that...
A low multiple is not a buy signal. It is only permission to investigate further. The buyer still has to ask the harder questions:
Why is this cheaper?
Is the layout weak?
Is the location compromised?
Is the project too small, too old, or too hard to exit?
Is rental demand shallow?
Is the buyer pool narrower than it looks?
So the framework is not:
Low multiple = buy.
It is closer to:
High multiple = slow down.
Low multiple = maybe worth studying.
But project quality still decides whether cheap is opportunity or trap.
That is the real shape of the tool. It helps you avoid obviously stretched entries. It does not remove the need to understand the asset.
Entry Multiple Framework
| Entry Multiple | Label | How To Read It | Buyer Action |
|---|---|---|---|
| Below 8 | Strong Candidate | Entry price looks friendly relative to the regional market cycle. | Worth shortlisting, then checking project quality and exit demand. |
| 8 to 12 | Shortlist | Still within a broadly reasonable range for many profitable resale outcomes. | Proceed only if the project has clear demand, location, and resale support. |
| 12 to 14 | Investigate Further | The entry price is getting stretched. Outcomes remain possible, but the margin is thinner. | Ask what justifies the premium and compare against nearby alternatives. |
| 14 to 16 | Risky | Historical outcomes weaken materially in this range. | Do not proceed unless there is a very strong project-specific reason. |
| 16 to 20 | Very Risky | The margin of safety is thin. A good project can still work, but the entry price is doing very little for you. | Pause hard. The burden of proof is on the buyer. |
| Above 20 | Walk Away Unless Exceptional | In the full dataset, this band flips into median loss territory. | Only consider if the asset is genuinely exceptional, scarce, and not comparable to normal condo stock. |
The Entry Multiple is not a buy button. It is a stress reading. A low number does not prove that a property is good; some cheap properties stay cheap for structural reasons. But a high number tells you the entry price is already stretched, and the buyer needs a much stronger reason to proceed.
Note: These bands were not chosen from the examples below. They came from a separate analysis of more than 20,000 transactions from 2024 to present. The examples in this article are used to illustrate how the framework behaves.
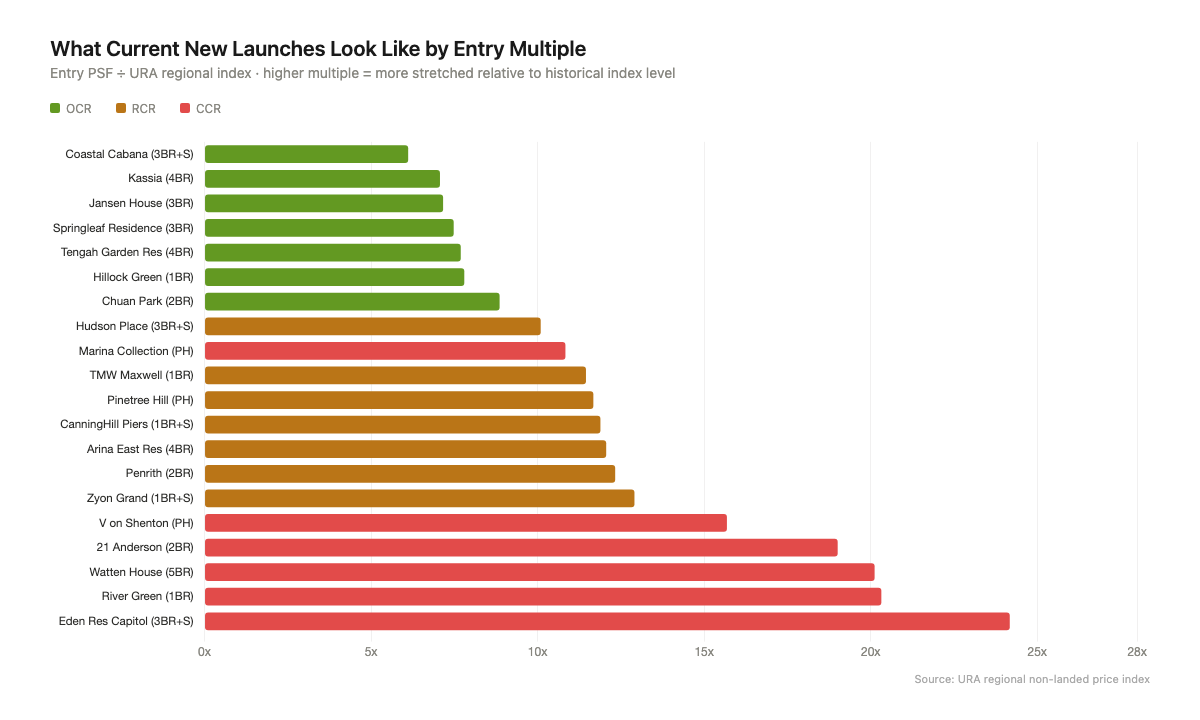
What Current New Launches Look Like By Entry Multiple
| Project | Region | Unit | Entry PSF | Entry Multiple | Entry Price |
|---|---|---|---|---|---|
| Coastal Cabana | OCR | 3 BR + S | $1,721 | 6.34 | $1.58M |
| Kassia | OCR | 4BR | $1,989 | 7.33 | $2.68M |
| Jansen House | OCR | 3BR | $2,017 | 7.43 | $2.04M |
| Springleaf Residence | OCR | 3BR | $2,107 | 7.76 | $2.65M |
| Tengah Garden Residences | OCR | 4BR | $2,167 | 7.98 | $2.71M |
| Hillock Green | OCR | 1BR | $2,196 | 8.09 | $1.51M |
| Chuan Park | OCR | 2BR | $2,493 | 9.19 | $2.07M |
| Hudson Place Residences | RCR | 3 BR + S | $2,396 | 10.47 | $2.45M |
| Marina Collection | CCR | Penthouse | $1,783 | 11.24 | $6.70M |
| TMW Maxwell | RCR | 1BR | $2,719 | 11.88 | $1.32M |
| Pinetree Hill | RCR | Penthouse | $2,773 | 12.11 | $7.97M |
| CanningHill Piers | RCR | 1 BR + S | $2,823 | 12.33 | $1.52M |
| Arina East Residences | RCR | 4BR | $2,863 | 12.51 | $3.98M |
| Penrith | RCR | 2BR | $2,928 | 12.79 | $1.80M |
| Zyon Grand | RCR | 1 BR + S | $3,065 | 13.39 | $1.45M |
| V on Shenton | CCR | Penthouse | $2,581 | 16.27 | $16.00M |
| 21 Anderson | CCR | 2BR | $3,128 | 19.72 | $10.00M |
| Watten House | CCR | 5BR | $3,310 | 20.87 | $7.84M |
| River Green | CCR | 1BR | $3,343 | 21.08 | $1.40M |
| Eden Residences Capitol | CCR | 3 BR + S | $3,978 | 25.08 | $11.94M |