Even 15 years of holding could not save buying at a lousy entry price (CCR Losers)
The CCR article mapped a loss cluster: nine CCR projects where patience has not paid off. That article left a question hanging.
This article attempts to build that formula. It partly works. What emerges is something more useful than a single number and the first clue we got is that:
The losses in the CCR do not divide along PSF. They divide along unit size.
Across 20 CCR projects tracked here, buyers of units under 600 sqft above $2,000 PSF show a 0% win rate on resale after 10 to 15 years. Buyers of units above 1,400 sqft at similar PSF levels mostly recovered. Some profited substantially once they held past 15 years.
The same variable that determines whether a loss is permanent or temporary is not the PSF paid at entry. It is how many square feet you bought.
The Two Ways to Lose Money in the CCR
The CCR loss cluster breaks into two structurally different failure modes. They look similar from the outside — both involve paying above $2,000 PSF in a prime district — but they behave completely differently over time.
Failure Mode 1: Small units. The loss does not recover.
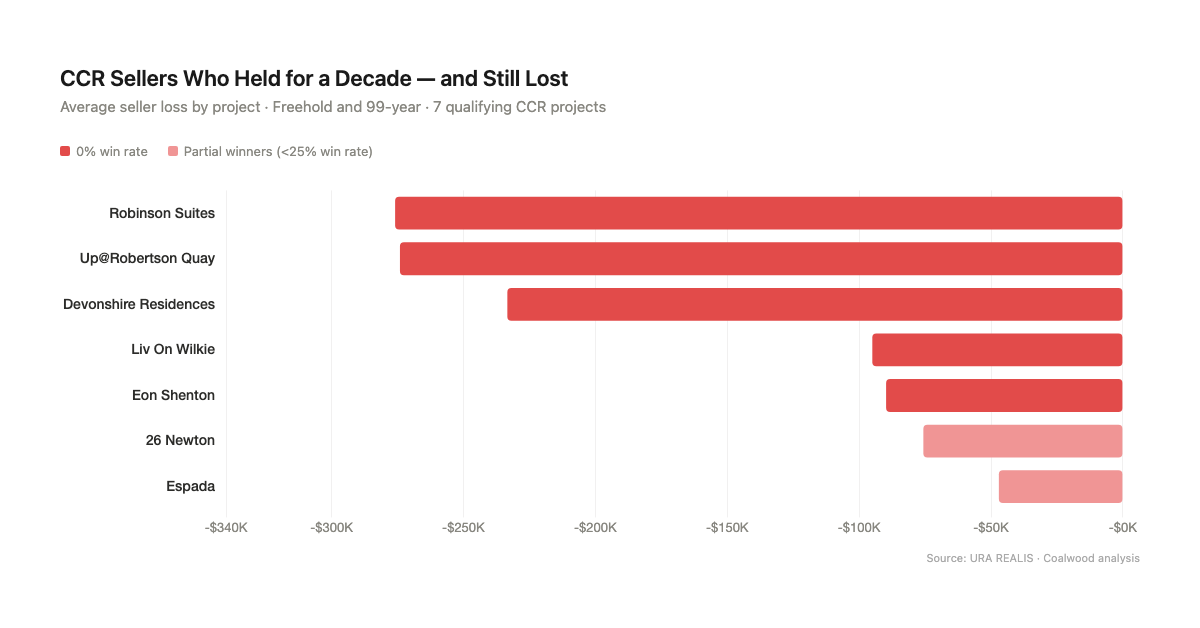
| Project | Size (sqft) | Typical PSF | Avg Loss | Win Rate | Avg Hold | Tenure | District |
|---|---|---|---|---|---|---|---|
| Robinson Suites | 495 | $2,327 | -$289,920 | 0% | 14.3 yrs | Freehold | D1 Downtown Core |
| Devonshire Residences | 495 | $2,091 | -$245,212 | 0% | 13.1 yrs | Freehold | D9 River Valley |
| Espada | 560 | $2,290 | -$49,416 | 12.5% | 12.7 yrs | Freehold | D9 River Valley |
| Liv On Wilkie | 527 | $2,313 | -$99,825 | 0% | 11.1 yrs | Freehold | D9 Rochor |
| 26 Newton | 560 | $2,217 | -$79,490 | 21.1% | 6.8 yrs | Freehold | D11 Novena |
| Up@Robertson Quay | 560 | $2,069 | -$288,000 | 0% | 10.5 yrs | 99-year | D9 Singapore River |
| Eon Shenton | 538 | $2,155 | -$94,333 | 0% | 9.7 yrs | 99-year | D2 Downtown Core |
Failure Mode 2: Large units. The loss is real — but most sellers eventually recover.
| Project | Size (sqft) | Typical PSF | Avg Outcome | Win Rate | Avg Hold | Tenure | District |
|---|---|---|---|---|---|---|---|
| Cityvista Residences | 2,626 | $2,067 | -$208,605 | 60% | 14.7 yrs | Freehold | D9 Newton |
| Orchard Scotts | 2,228 | $1,753 | -$154,288 | 38.5% | 10.2 yrs | 99-year | D9 Newton |
| St Thomas Suites | 2,605 | $2,322 | +$444,225 | 92.9% | 14.2 yrs | Freehold | D9 River Valley |
| Orchard View | 2,530 | $2,767 | -$1,497,905 | 0% | 13.9 yrs | Freehold | D9 River Valley |
| St Regis Residences | 2,153 | $2,501 | +$5,875 | 30% | 8.8 yrs | 999-year | D10 Orchard |
The key difference between the two failure modes: Large-unit CCR sellers show a recovery arc. At 10–15 years, most are losing. At 15–20 years, most are profiting. For small-unit CCR sellers, that arc does not appear in the data at all.
Robinson Suites buyers averaged 14.3 years of holding. Still 0%.
The Small-Unit Trap: Why Freehold Status Changes Nothing Here
This is the finding that should disturb any buyer considering a 500 sqft CCR one-bedder in 2026.
Five of the seven projects in the small-unit table are freehold.
Robinson Suites in D1
Devonshire Residences in D9
Espada in D9
Liv On Wilkie in D9
26 Newton in D11
They are spread across four planning areas. The tenure argument - that freehold is a safer long term investment does not hold for sub-600 sqft units in this price band. The most common competing explanation is timing: these buyers entered during the 2010–2015 peak-cycle window and are paying for when they bought, not what they bought.
URA Property Price Index — Non-Landed Residential
Source: URA Private Residential Time Series Statistics
That explanation partially holds for the large-unit failure mode, where the worst individual losses belong to buyers who entered in 2006–2008, before the subprime mortgage crisis hit. But for the small-unit projects, the timing overlap is not clean enough to carry the full weight of the explanation.
Up@Robertson Quay buyers averaged 10.5-year holds
Eon Shenton buyers averaged 9.7 years.
These are not people who bought at a single frothy quarter and got out at the next peak. The 0% win rate holds across a range of entry points within the 2010–2016 window, across two different tenure types, across three distinct planning areas.
The more structural explanation and the one the data actually supports is that sub-600 sqft CCR units above $2,000 PSF attract a narrow exit pool.
- They cannot easily be purchased by CPF-reliant Singaporean buyers.
- They do not suit families.
- At the quantum involved (roughly $1.0M–$1.4M per unit), they compete with larger resale options in RCR/OCR that offer more space for the same dollar.
The buyer who would pay $1.15M for a 495 sqft CCR one-bedder is almost always an investor and the next investor needs to believe the same rental income story at a higher entry price. That belief has not materialised across 10–15 year holds at any of these seven projects.
Rental income is real but it does not rescue the capital.
| Project | Size (sqft) | Buy PSF | Typical 1BR Monthly Rent | Rent PSF | Est. Gross Yield |
|---|---|---|---|---|---|
| Robinson Suites | 495 | $2,327 | $3,700 | $7.82 | ~3.8% |
| Devonshire Residences | 495 | $2,091 | $3,500 | $7.11 | ~4.1% |
| Up@Robertson Quay | 560 | $2,069 | $3,900 | $7.80 | ~4.5% |
| Espada | 560 | $2,290 | $3,350 | $8.57 | ~4.3% |
| Liv On Wilkie | 527 | $2,313 | $3,200 | $7.11 | ~3.9% |
| 26 Newton | 560 | $2,217 | $3,250 | $7.13 | ~4.2% |
These are gross yields — before stamp duty, agent fees, maintenance, and financing costs. At Robinson Suites, a buyer who purchased a 495 sqft unit at $2,327 PSF paid roughly $1.15M. The average capital loss across resale transactions there is $289,920 spread over 14.3 years, about $20,300 in capital erosion each year. The gross rental income at $3,700/month is $44,400/year. The rental income more than offsets the annual capital erosion on a cash-flow basis. But after 14 years, the capital has not recovered. The rental income kept the investment liveable. It did not make it profitable.
The CCR rental index, for context, peaked at 155.3 in Q3 2023 and has since eased to 151.1 in Q1 2026 — roughly flat over three years. There is no evidence of a rental surge large enough to change this arithmetic.
The Large-Unit Failure Mode: Recoverable, But the Clock Is Longer Than Anyone Plans For
The large-unit loss projects tell a different story. The losses are bigger in absolute terms — Orchard View averages -$1.5M per transaction with a 0% win rate over 13.9 years — but across the full CCR large-unit loss cohort, most sellers eventually cross into profit. The critical question is when.
| Project | Loss at 10–15 Years | Profit at 15–20 Years | Transactions (each band) |
|---|---|---|---|
| St Thomas Suites | -$1,186,017 avg | +$812,150 avg | ~3–5 per band |
| Soleil @ Sinaran | -$245,500 avg | +$1,042,788 avg | ~3–5 per band |
| The Sail @ Marina Bay | -$153,003 avg | +$231,845 avg | ~3–5 per band |
| Draycott Eight | -$292,500 avg | +$231,460 avg | ~3–5 per band |
| Icon | -$74,000 avg | +$208,438 avg | ~3–5 per band |
The pattern across all five projects is the same: sellers at 10–15 years are losing; sellers at 15–20 years are profiting. The inflection sits somewhere between those two windows, likely around the 14–16 year mark, depending on entry price.
The honest answer to "how long do I need to hold?"
For large-unit CCR: roughly 15 years, if you bought during the 2010–2016 window. For small-unit CCR: the data shows no recovery arc at any hold length tracked so far. 14.3 years at Robinson Suites. Still 0%.
Cityvista Residences shows why entry price matters more clearly than the project-level average. On paper, Cityvista does not look like a disaster. The overall project win rate is about 60%, which means most sellers made money. But the losses are concentrated in a very specific cohort: buyers who entered during the 2005–2007 peak, at prices that were extreme for that era.
The clearest example is one large-unit transaction bought in 2007 at roughly $2,800 psf. That is not just expensive in 2007 terms. It is roughly where some CCR new launches still start in 2026. The buyer held for about 17–19 years and still exited with an almost $2M loss.
That is the uncomfortable part. Time alone did not save the entry.
Cityvista was not uniformly bad. Later buyers, or buyers who entered at less aggressive prices, did fine. But the peak-entry cohort paid such a large upfront premium that even nearly two decades of holding power could not fully repair the mistake.
The Ratio Framework: What It Can and Cannot Say
The question is not just whether a buyer paid a high PSF. It is whether they paid a high PSF relative to where the CCR market already was at the time.
Using URA’s CCR non-landed private residential price index, the current index is 158.6 in Q1 2026. A buyer paying $2,300 psf for a CCR condo today is paying roughly 14.5 psf per CCR index point.
That gives us a cleaner way to look at past mistakes.
During the 2012–2015 period, the CCR index mostly sat between about 128 and 141. Buyers who paid $2,000–$2,400 psf during that period were not merely buying “expensive CCR condos”. They were entering at ratios of roughly 14.2 to 18.7 psf per CCR index point.
That is already a much more stretched entry than a $2,300 psf buyer in 2026.
The Cityvista example is even sharper. One buyer paid roughly $2,800 psf in 2007. The CCR index in 2007 ranged from about 100.7 to 126.5. Depending on the exact quarter, that implies an entry ratio of roughly 22 to 28 psf per CCR index point.
That is the whole problem in one number.
A $2,800 psf entry in 2026 would already be a premium CCR purchase. A $2,800 psf entry in 2007 was something else entirely. The buyer was not just paying a high price. They were paying a high price when the market index itself was much lower. The entry was so stretched that even a 17–19 year holding period could not fully repair it.
So the ratio is not a magic valuation formula. It does not tell you whether a specific unit is good or bad on its own. It still needs to be read with size, tenure, project quality, floor level, buyer pool, and transaction context.
But it does explain why raw PSF is not enough.
Two buyers can both pay $2,300 psf. One may be entering when the CCR index is 158.6. Another may have entered when the CCR index was 130. Those are not the same decision. The PSF is the same. The market context is not.
To be clear, this is a working framework, not an established industry metric.
You will not usually see agents, portals, or public market reports talk about CCR condos this way. Most discussions stop at raw PSF, quantum, tenure, district, or project comparison. This ratio is an attempt to ask a slightly different question: not just “was the PSF high?”, but “was the PSF high relative to where the CCR market index was at the time?”
That makes it useful, but also early.
The framework still needs to be tested across more projects, more districts, different unit sizes, and different holding periods. It may prove more useful in some segments than others. It may also need adjustment for freehold projects, large-format luxury stock, boutique supply, and one-off trophy assets.
So the ratio should not be read as a buy/sell signal. It is better understood as a stress-test. If the ratio looks extreme, it tells us to ask harder questions about whether the entry premium is likely to be defensible later.
What the Winners Have in Common
The CCR projects with the best outcomes share a consistent profile. Not lower PSF — The Imperial in D9 transacted at $2,495 PSF, well within the range of the loss projects. What they share is unit size and tenure.
| Project | Size (sqft) | Typical PSF | Avg Profit | Win Rate | Avg Hold | Tenure | District |
|---|---|---|---|---|---|---|---|
| Ardmore Park | 2,885 | $4,195 | +$4,841,612 | 100% | 15.7 yrs | Freehold | D10 Newton |
| Grange Residences | 2,852 | $3,397 | +$4,248,044 | 100% | 17.8 yrs | Freehold | D10 Tanglin |
| Four Seasons Park | 2,260 | $3,344 | +$2,682,688 | 87.5% | 13.7 yrs | Freehold | D10 River Valley |
| Sky@Eleven | 2,713 | $2,298 | +$2,223,054 | 100% | 13.7 yrs | Freehold | D11 Toa Payoh |
| Leedon Residence | 2,131 | $2,762 | +$1,700,028 | 96.4% | 8.3 yrs | Freehold | D10 Bukit Timah |
| The Imperial | 1,443 | $2,495 | +$1,928,145 | 100% | 16.6 yrs | Freehold | D9 Museum |
The Imperial is the most useful comparison in this data. It sits in D9 — the same district as Devonshire Residences, Espada, Liv On Wilkie, and Up@Robertson Quay. It transacted at $2,495 PSF, slightly above the small-unit losers in that district. It is freehold. The only material structural difference is that its typical unit is 1,443 sqft — roughly 2.5 to 3 times the size of the small-unit losers. Over 16.6 years, every single seller made money. Average profit: $1.93M.
Leedon Residence (Farrer Road, about 6 minutes from Farrer Road MRT on the Circle Line) is the fastest turnaround in the winner group — 8.3-year average hold, 96.4% win rate. It suggests that freehold large-unit CCR can produce strong outcomes on shorter holds too, but it is a higher-quantum entry than most buyers in the $2,000–$2,500 PSF band will be evaluating.
Sky@Eleven (Toa Payoh Rise, near Braddell MRT on the North-South Line) demonstrates that the winner profile does not require the absolute premium locations. $2,298 PSF is not dramatically different from the small-unit loss cluster. But at 2,713 sqft per typical unit, it reaches a buyer pool that can finance with CPF, qualify for conventional loans, and contemplate owner-occupation — structurally different exit demand than a 500 sqft one-bedder.
What the Evidence Supports and What It Does Not
The small-unit trap is the clearest finding in this data. Seven projects. Four districts. Freehold and leasehold both represented. Holds from 9.7 years to 14.3 years. Not a single project showing even half its sellers break even. That is not a cycle-timing story — it is a structural pattern.
The large-unit story is genuinely conditional. Most sellers at large-unit CCR projects recover. The minority who do not are almost exclusively buyers who entered at the absolute cycle peak in 2005–2008, and some of them are still waiting after 18–19 years. The recovery arc data across five projects shows the inflection happens between 10 and 15 years — but those are 3–8 transactions per band. Treat the direction as reliable; the precise year as less so.
The rental yield story is not a counterargument to either finding. Gross yields of 3.8–4.5% on small-unit CCR are real and consistent. Robinson Suites has had 235 rental transactions over two years — the demand is active. But rental income offsets the annual capital erosion rather than reversing it. After 14 years, the capital position at Robinson Suites has not recovered. The tenants kept the investment breathing. They did not make it profitable.
For the buyer in 2025–2026 looking at a 500 sqft CCR one-bedder at $2,300 PSF: the resale record says that the same unit, at the same approximate PSF, across multiple CCR districts, over 10–15 years, has not produced a single break-even seller in this data. Whether 2025 entry conditions are different enough to change that pattern is not something this data can answer. The CCR rental ceiling is roughly flat. The exit buyer pool for tiny CCR units has not structurally widened. The ratio sits slightly more favourably than the loss cohort's entry conditions — but the unit-size problem is independent of where the index sits.
That is the honest state of the evidence. The pattern of CCR losses that started this investigation is examined in full in the prior article.
Market Intelligence — CCR Resale Loss and Winner Analysis Projects tracked: 20+ | Data period: resale transactions from approximately 2007–2025 | Districts: D1, D2, D9, D10, D11
Key metrics from this analysis:
- Worst small-unit outcome: Robinson Suites — avg loss $289,920 over 14.3 years, 0% win rate, 495 sqft freehold D1
- Best large-unit recovery: Ardmore Park — avg profit $4,841,612 over 15.7 years, 100% win rate, 2,885 sqft freehold D10
- PSF-matched counter-case: The Imperial — $2,495 PSF, 1,443 sqft, avg profit $1,928,145, 100% win rate over 16.6 years
- Recovery inflection (large-unit): Approximately 15 years — projects losing at 10–15yr bands profit at 15–20yr bands
- URA overall non-landed index (Q1 2026): 210.8 | CCR rental index (Q1 2026): 151.1
| Project | Size (sqft) | PSF | Avg Outcome | Win Rate | Avg Hold | Tenure | District | Failure Mode |
|---|---|---|---|---|---|---|---|---|
| Robinson Suites | 495 | $2,327 | -$289,920 | 0% | 14.3 yrs | FH | D1 | Small-unit trap |
| Devonshire Residences | 495 | $2,091 | -$245,212 | 0% | 13.1 yrs | FH | D9 | Small-unit trap |
| Up@Robertson Quay | 560 | $2,069 | -$288,000 | 0% | 10.5 yrs | 99-yr | D9 | Small-unit trap |
| Eon Shenton | 538 | $2,155 | -$94,333 | 0% | 9.7 yrs | 99-yr | D2 | Small-unit trap |
| Liv On Wilkie | 527 | $2,313 | -$99,825 | 0% | 11.1 yrs | FH | D9 | Small-unit trap |
| Espada | 560 | $2,290 | -$49,416 | 12.5% | 12.7 yrs | FH | D9 | Small-unit trap |
| 26 Newton | 560 | $2,217 | -$79,490 | 21.1% | 6.8 yrs | FH | D11 | Small-unit trap |
| Orchard View | 2,530 | $2,767 | -$1,497,905 | 0% | 13.9 yrs | FH | D9 | Large-unit peak entry |
| Cityvista Residences | 2,626 | $2,067 | -$208,605 | 60% | 14.7 yrs | FH | D9 | Large-unit mixed |
| Orchard Scotts | 2,228 | $1,753 | -$154,288 | 38.5% | 10.2 yrs | 99-yr | D9 | Large-unit mixed |
| St Regis Residences | 2,153 | $2,501 | +$5,875 | 30% | 8.8 yrs | 999-yr | D10 | Large-unit short hold |
| St Thomas Suites | 2,605 | $2,322 | +$444,225 | 92.9% | 14.2 yrs | FH | D9 | Large-unit recovery |
| The Imperial | 1,443 | $2,495 | +$1,928,145 | 100% | 16.6 yrs | FH | D9 | Winner |
| Sky@Eleven | 2,713 | $2,298 | +$2,223,054 | 100% | 13.7 yrs | FH | D11 | Winner |
| Leedon Residence | 2,131 | $2,762 | +$1,700,028 | 96.4% | 8.3 yrs | FH | D10 | Winner |
| Four Seasons Park | 2,260 | $3,344 | +$2,682,688 | 87.5% | 13.7 yrs | FH | D10 | Winner |
| Grange Residences | 2,852 | $3,397 | +$4,248,044 | 100% | 17.8 yrs | FH | D10 | Winner |
| Ardmore Park | 2,885 | $4,195 | +$4,841,612 | 100% | 15.7 yrs | FH | D10 | Winner |
FH = Freehold. PSF figures reflect typical exit transaction PSF from resale data. Win rate and avg outcome figures are project-level resale aggregates. Transaction counts per project range from approximately 8 to 28 resale transactions.